
AppCode for macOS
The 2023.1.5 update is a bug-fix release, resolving a security issue in the JetBrains GitHub Plugin. If you have the plugin installed, grabbing this update is a sensible move.
Let's walk through a common task: refactoring a Swift structure that has grown messy over several commits. You open your .xcodeproj or .xcworkspace directly in AppCode. The IDE synchronizes with Xcode, so the project index reflects your current scheme and build settings. You place the cursor on the struct name and invoke Refactor This. Because AppCode understands the syntax tree, it offers to rename the struct and update every call site across the whole project — not just a textual find-and-replace.
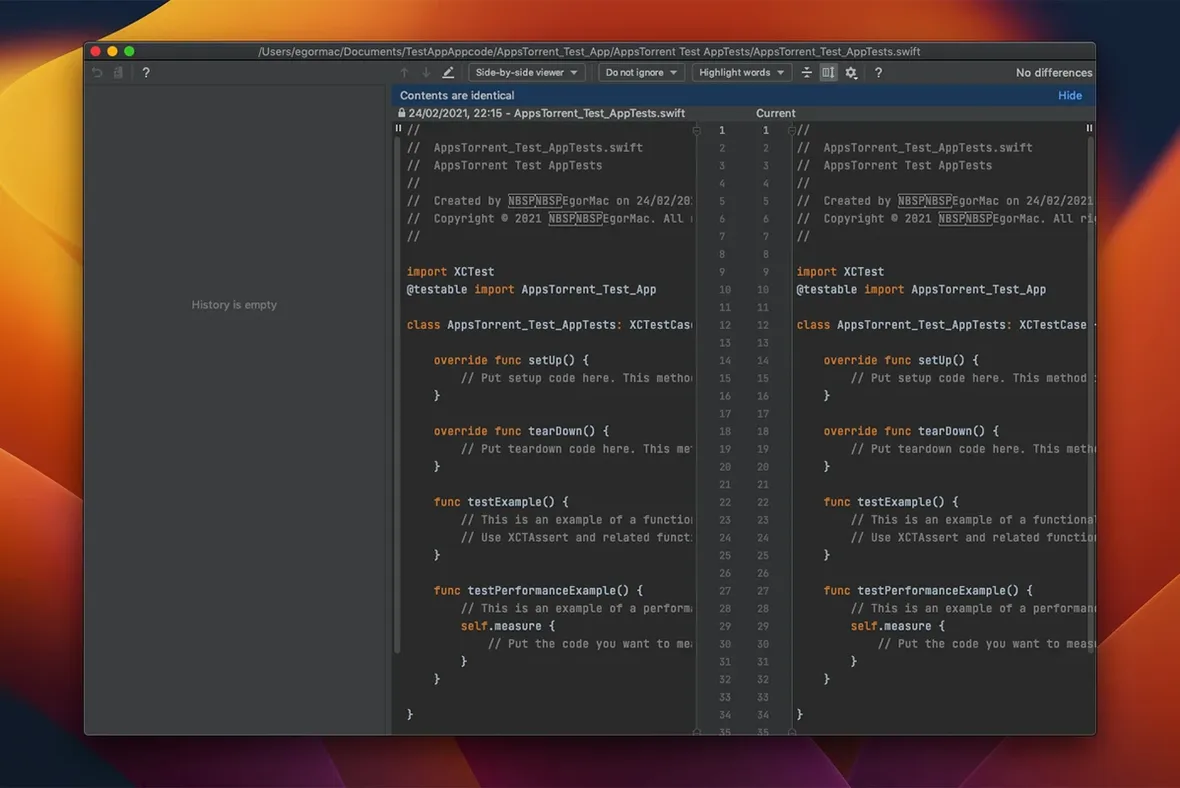
During the rename, the on-the-fly code analysis flags a potential problem: a property that was previously inferred now has an ambiguous type. You stop and use Create declaration from usage to generate the missing initializer, letting the IDE write the boilerplate. The version control integration shows your uncommitted changes in a unified diff; you can roll back just the init addition while keeping the rename. Once you are satisfied, you switch back to Xcode and the project is already in sync, ready for a build.
What does a normal working session look like?
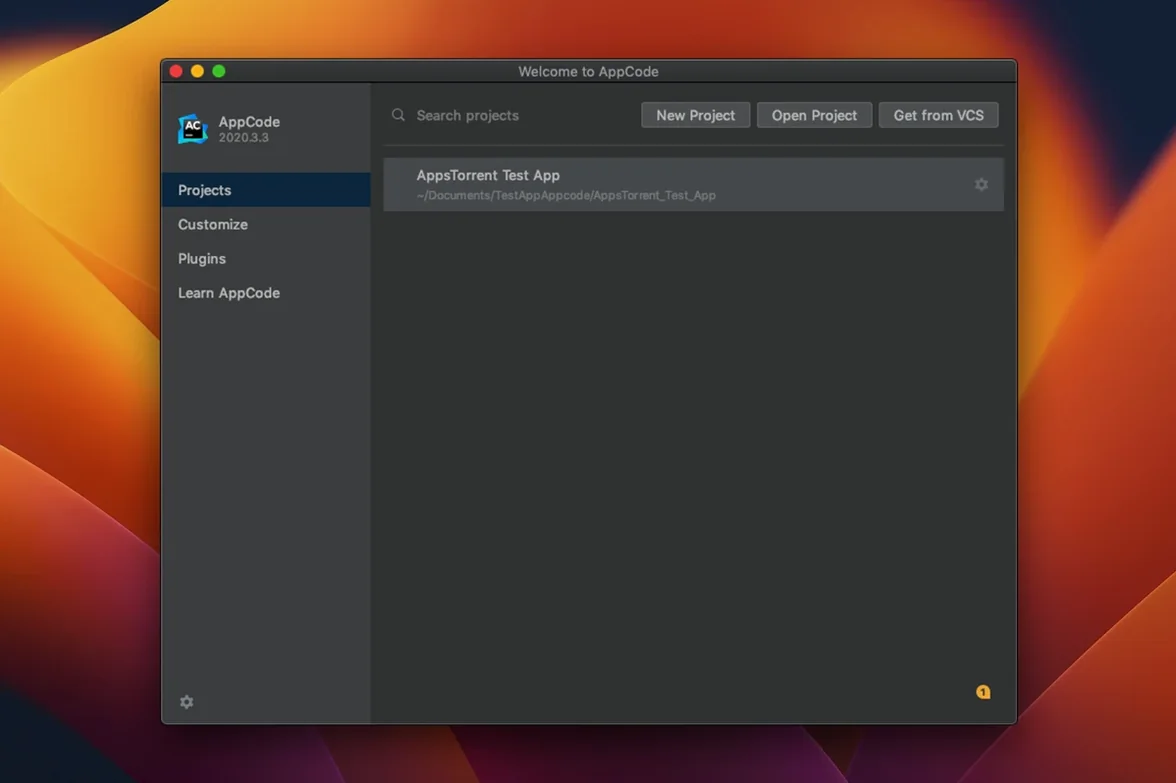
Say I'm tasked with extracting a networking layer from a tangled view controller. I open the project in AppCode — it picks up the .xcworkspace immediately, and the indexing phase lasts maybe twenty seconds on an M1 machine. While that runs, CocoaPods integration kicks in and resolves the dependency graph without me touching Terminal.
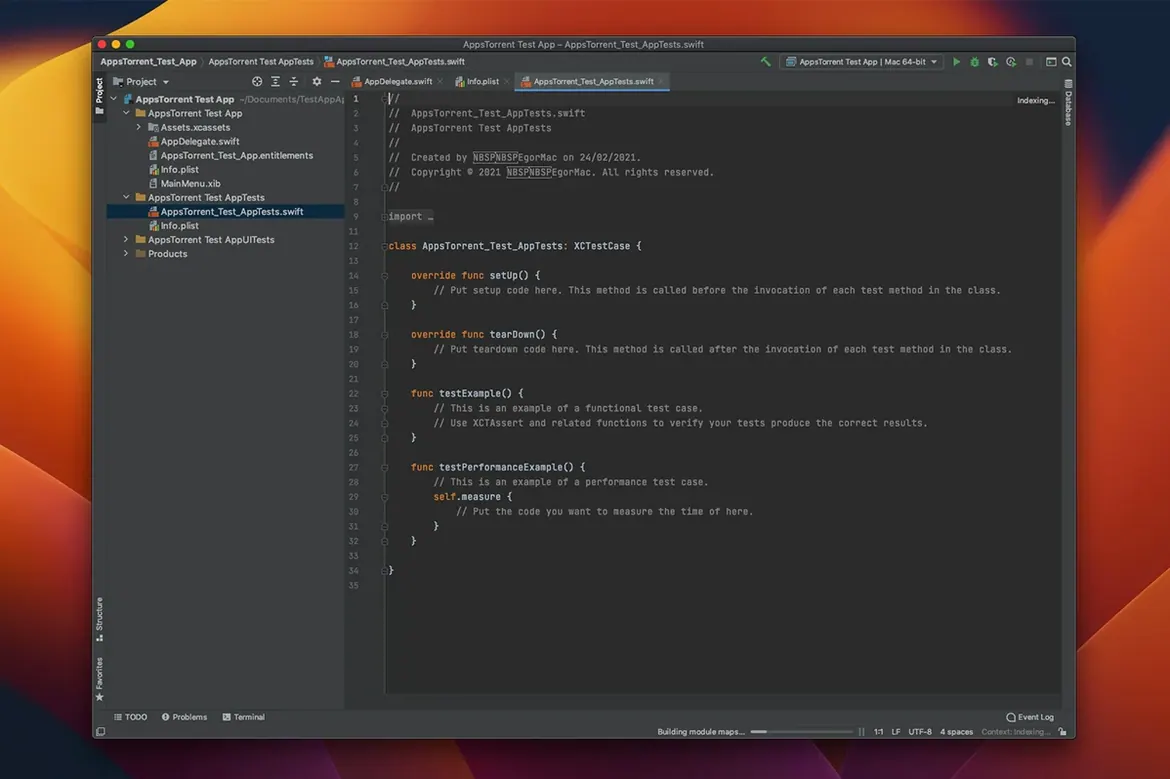
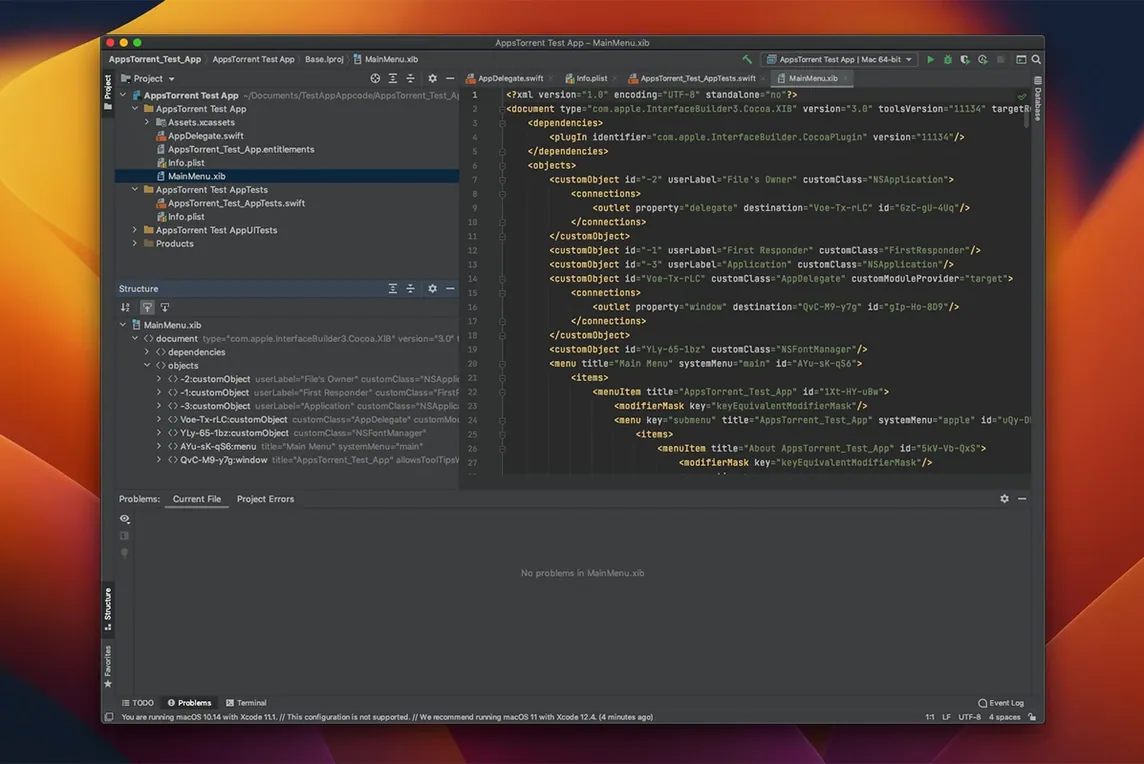
I start by opening the offending ViewController.m. The structure view on the left gives me a flat list of methods — much faster to scan than scrolling through 800 lines. I select three methods that handle URL session tasks, right-click, and choose Refactor > Extract > Class. AppCode scans for internal dependencies, spots a captured @property that should move along, and asks if I want to include it. A few keystrokes later I have a new NetworkService class in its own file pair, and every call site in the view controller now imports and references it correctly.
Next I write a quick unit test for the new class. AppCode's test runner recognizes Kiwi specs without extra configuration — I hit Ctrl+Shift+R and the test executes inline, showing a green checkmark in under a second. The on-the-fly analysis catches a nullable-to-nonnull mismatch before I even run, saving me a cryptic runtime crash.
Throughout the session, version control diff view stays open in a bottom tab. After the extraction I review the changeset: three files modified, two added. I write a commit message and push, all inside the IDE. No Xcode restart, no lost breakpoints — the projects stay synchronized because AppCode writes directly to the same .xcodeproj bundle Xcode reads.
How does it behave under load?
AppCode is a JVM application, so it carries the memory habits you would expect from an IntelliJ-based IDE. On a 16 GB MacBook Pro, a mid-sized project with around 300 Objective-C files and a dozen Swift modules settles at roughly 1.2–1.8 GB of RAM usage once indexing completes. The initial indexing pass after opening a fresh project can spike CPU for a minute or two — fans become audible on Intel machines — but incremental indexing during editing is nearly imperceptible on Apple Silicon.
Autocompletion responsiveness depends on whether you are in Swift or Objective-C. Objective-C completion is snappy; the parser has been mature for years. Swift completion in the 2023.1.5 release occasionally hesitates on complex generic constraints, lagging half a beat behind Xcode's integrated compiler. Still, the trade-off is that AppCode's completions are context-aware and rank results by type compatibility, not just alphabetical proximity — so the pause often saves a trip to the documentation.
I have left AppCode open across a full workday alongside Xcode, a simulator, and a dozen Safari tabs. No leaks or creeping sluggishness. The IDE responds to a garbage collection hint or a quick File > Invalidate Caches restart in under two minutes if things ever feel heavy.
Snags people tend to hit
Project file sync drift. If you add files in Xcode while AppCode is open, the index can go stale. The fix is straightforward: File > Synchronize (Cmd+Option+Y). That forces a re-read of the project bundle and usually clears up missing symbol complaints within seconds.
CocoaPods integration stalls. Sometimes the Podfile changes are not picked up automatically. Running a pod install from the built-in terminal, then triggering Synchronize, resolves it. If the IDE still cannot resolve pod headers, check that the Pods project is included in the workspace — AppCode reads what Xcode reads.
Swift package resolution. Swift Package Manager dependencies occasionally show red imports after a branch switch. Closing and reopening the project — not the entire IDE, just the project — forces a re-resolution cycle. This is quicker than waiting for the background task to catch up on its own.
Testing framework detection. When Quick or Kiwi tests suddenly appear as plain XCTest stubs, the likely culprit is a scheme mismatch. Open Run > Edit Configurations and verify the test runner is pointing at the active scheme, not a stale one left over from a branch change. The IDE remembers per-branch run configurations, which is useful until it is not.
- Bug-fix update.
- Fixed a security issue related to the JetBrains GitHub Plugin.
- macOS 10.15 or later
- Apple Silicon or Intel 64-bit Mac
Comments 0
Sign in or create an account to leave a comment.
No comments yet. A codec, a slice, a machine — they appear after moderation.