CLion for macOS
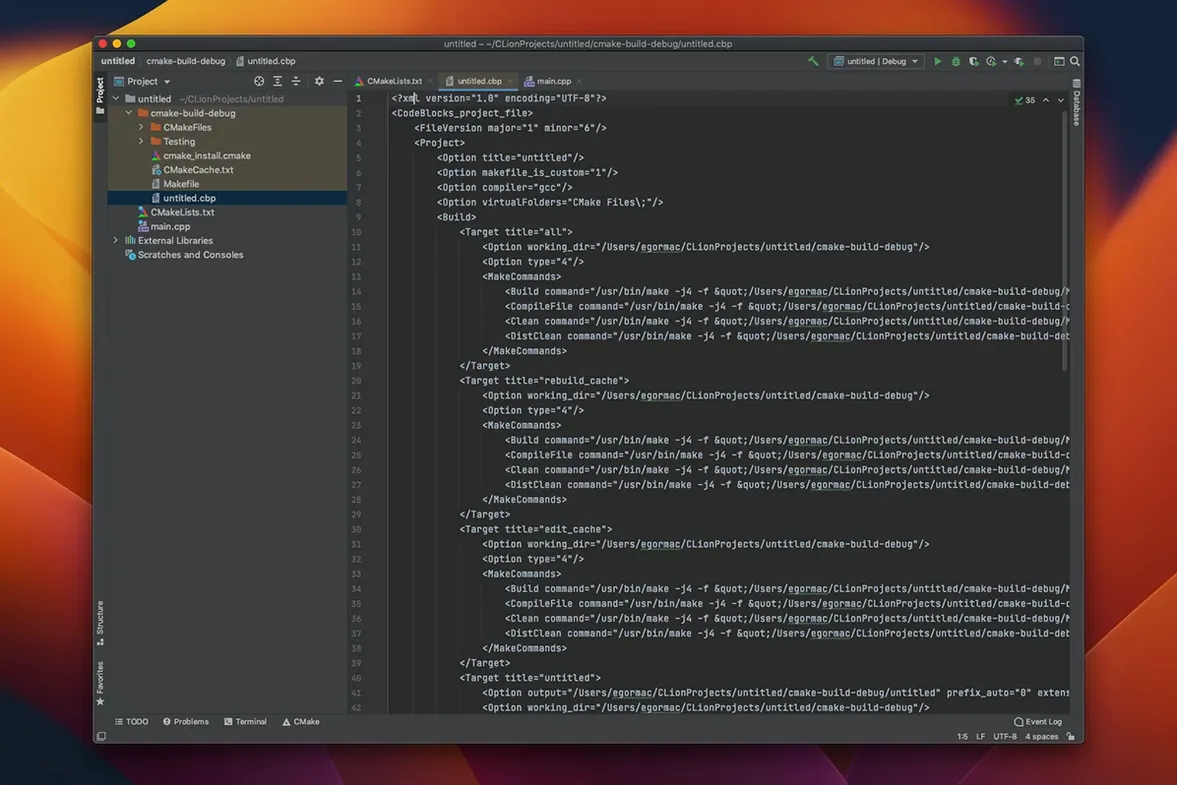
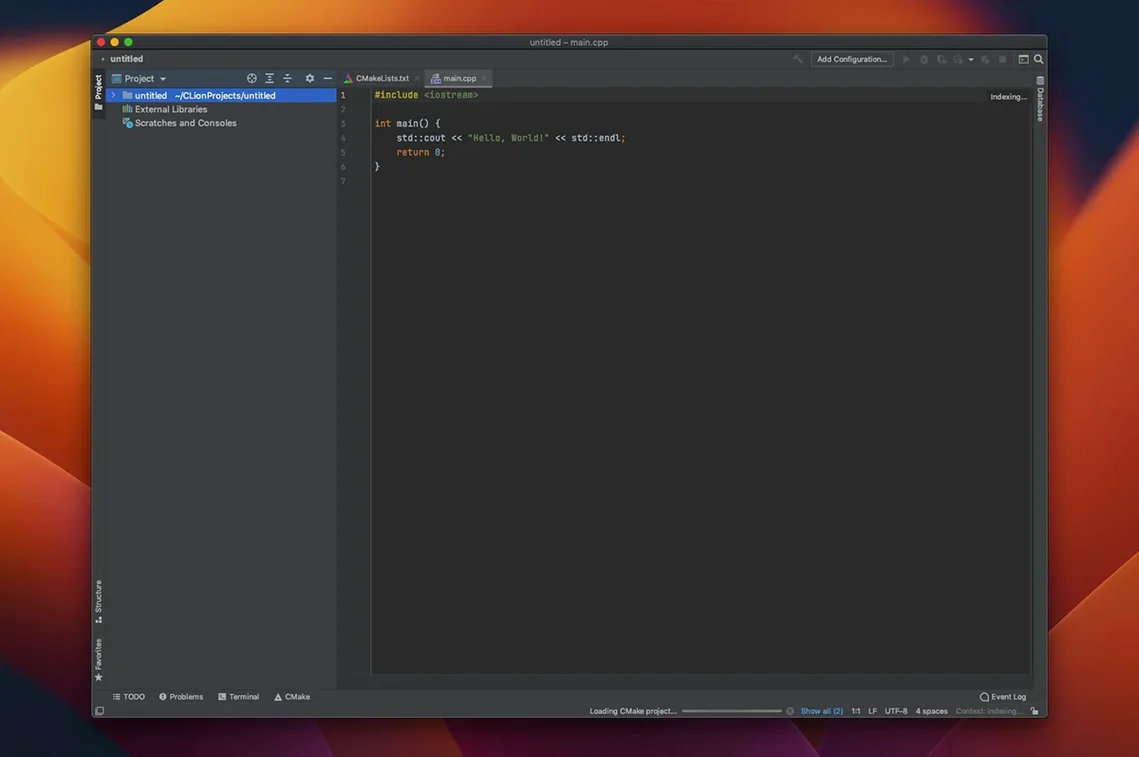
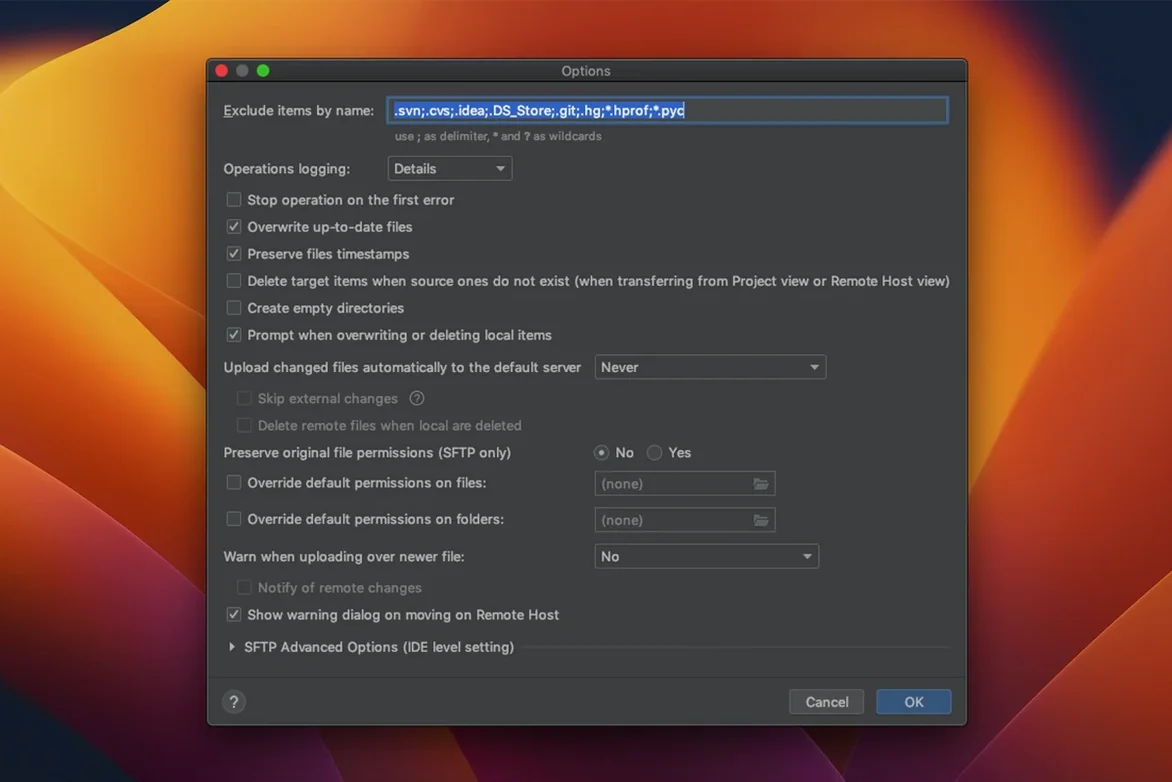
Over 50 built-in code inspections ship with the IDE, and that's before you even count the Clang-Tidy checks layered on top. CLion 2026.2.3 is JetBrains' current C and C++ environment for the Mac, and this build tightens the tooling around modern build systems.
- Meson build support jumps into the project models list this cycle, sitting alongside CMake, Makefile, Gradle, and compilation databases.
- Quick documentation popups now pull in formatted macro expansions, Doxygen comments, inferred types, and function signatures without leaving the editor.
- Data flow analysis works with the bundled Clangd checks to catch paths where variables might be used uninitialized or where logic always short-circuits.
- Context-aware symbol search lets you jump from a name to its definition or find every read and write usage filtered by scope, not just a flat text grep.
- Debugger watch expressions and the Variables view surface struct members, pointer chains, and STL container contents in a collapsible tree during a session.
- Breadcrumb navigation trails the code hierarchy above the editor, so jumping from a method body up to the enclosing namespace is a single click.
Therefactoring tools handle rename, extract function, and change signature across translation units, and the built-in version control interface gives you a single pane for diffing, history, and branching without switching to an external client. CLion still targets macOS 11 and runs native on both Intel and Apple Silicon Macs.
How fast do warnings appear after opening a CMake project?
You open a checkout of a CMake project — in my case, a small signal-processing library with about forty source files. CLion spends a few seconds indexing, then the yellow warnings start appearing: an int that might overflow, a branch the data flow analyzer marks as unreachable. Those aren't compiler errors yet; the IDE is just faster than make at spotting trouble.
I hit the debug button. The toolbar populates with a stepped control strip — step over, step into, force step into. A breakpoint on line 142 of fir_filter.cpp catches the first frame. The Variables pane shows the coefficient array as a collapsible tree, and I add a watch expression on accumulator / num_taps to see the running average update every loop iteration. LLDB is doing the heavy lifting underneath, but you never leave the editor to interact with it.
Mid-session I notice the function signature for apply_window() changed upstream. I right-click the old call site, pick Change Signature, and CLion rewrites every caller across the project without touching the unrelated methods. The refactoring preview window shows exactly which files will be touched before I commit to it, so there is no guessing.
When I need to trace how a constant trickles through a dozen #define chains, I hover over it and the quick documentation popup renders the fully expanded macro, not just the last line of the definition. That alone saves a trip to the terminal and a gcc -E invocation.
Why does letting CLion guess the project model backfire?
The most common one is ignoring the project model selection during import. If you point CLion at a folder with a CMakeLists.txt but let it guess the model, it sometimes latches onto the compilation database first. Then you lose CMake-specific inspections and the build menu gets confused. Always open the project via File → Open and pick the top-level CMakeLists.txt directly when that is what you actually build.
Another trap is mistaking the Clangd squiggles for compiler errors. CLion runs its own code analysis in parallel with Clang-Tidy, and the yellow inspection marks are often more strict than your actual toolchain warnings. New users sometimes chase an "unused variable" inspection that their release build flags would strip anyway. You can tune the inspection profile per scope — dial it back for a third-party library folder while keeping it aggressive on your own source tree.
Beginners also tend to set breakpoints on empty lines or inside inline functions the debugger cannot instrument. If the red dot does not stick after a click, check whether the line actually generates code in your current build configuration. Switching from Debug to Release in the run configuration often removes debug symbols silently, and then GDB or LLDB sits there with no hooks to grab.
Release notes for 2026.2.3.1 are hosted on the developer's site — this build rolls up their latest fixes and improvements.
- macOS 11 or newer
- Apple Silicon or Intel 64‑bit Mac
Comments 0
Sign in or create an account to leave a comment.
No comments yet. A codec, a slice, a machine — they appear after moderation.