
GraphPad Prism for macOS
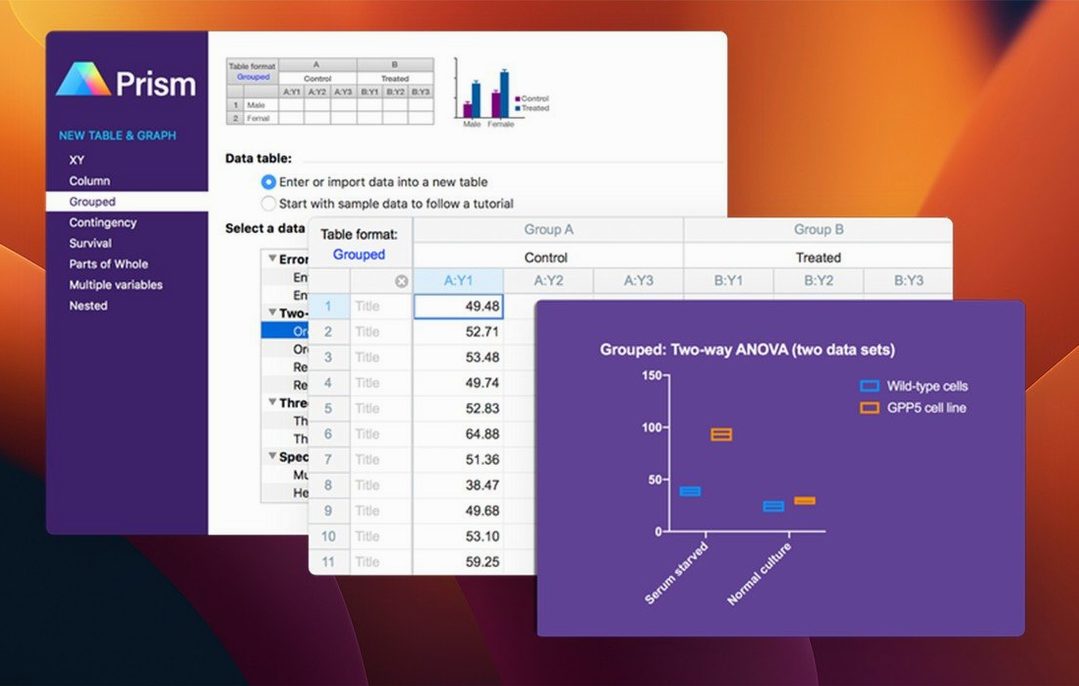
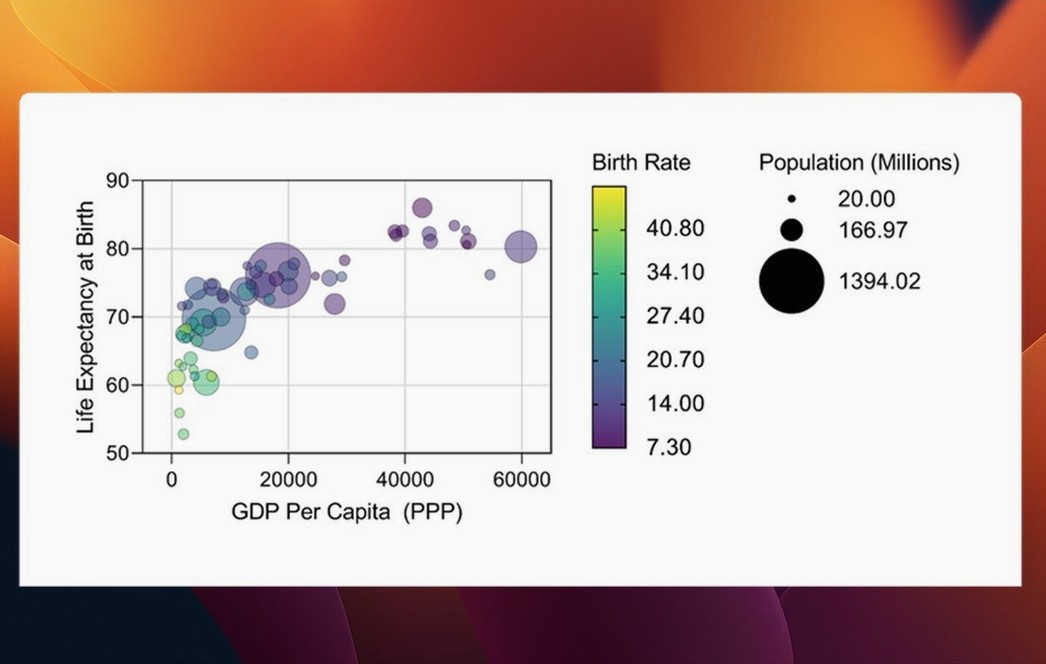
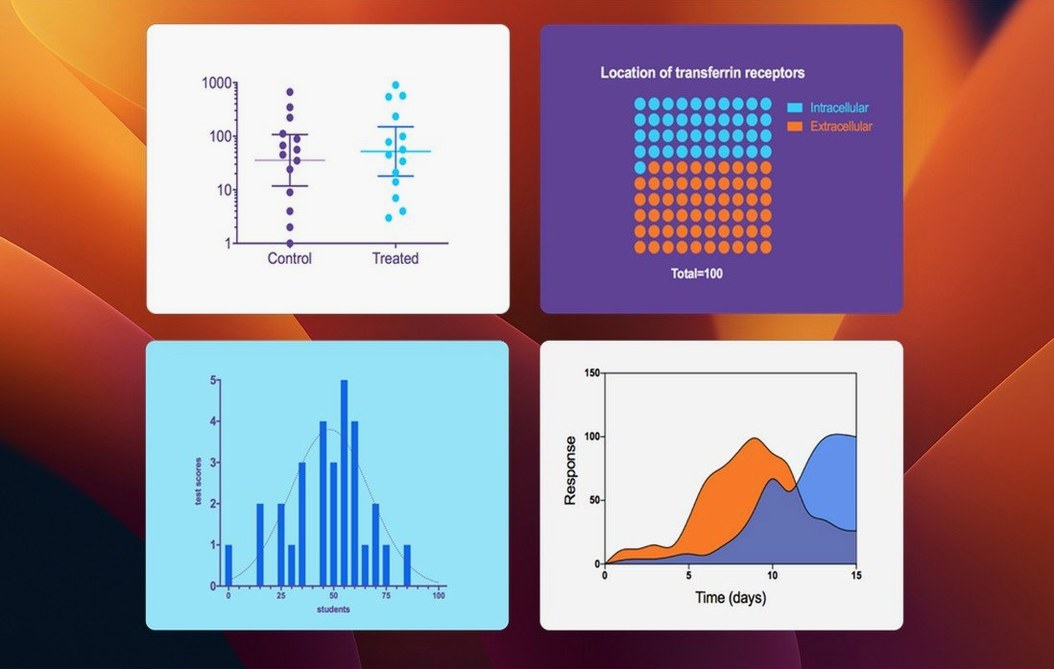
If you've spent any time in R or Python's matplotlib, you know the friction of translating a statistical question into code. GraphPad Prism sits on the other side of that divide — it's built around the structure of experimental data, not script syntax. Version 11.1.0 doubles down on that idea with new graph types and workflow tweaks that keep you in a thinking space rather than a typing one.
Take a repeated-measures experiment where you've tracked cell migration under three inhibitors across four time points. You lay out the data in a Multiple Variables table, which now respects categorical level ordering — so your "Low Dose" group stays visually before "High Dose" without manual trickery. From there, the analysis dialog presents a streamlined variable selector. Choosing a two-way ANOVA feels less like navigating a menu and more like answering a series of natural questions about your design.
Once the math runs, the graphing engine gives you options that match the table type. Instead of building every plot element from scratch, you pick from bars, box-and-whisker plots, or violin plots that are already wired to the underlying stats. The violin plot, in particular, shows the full distribution shape at each time point, making it easy to spot bimodal responses that a bar chart would hide.
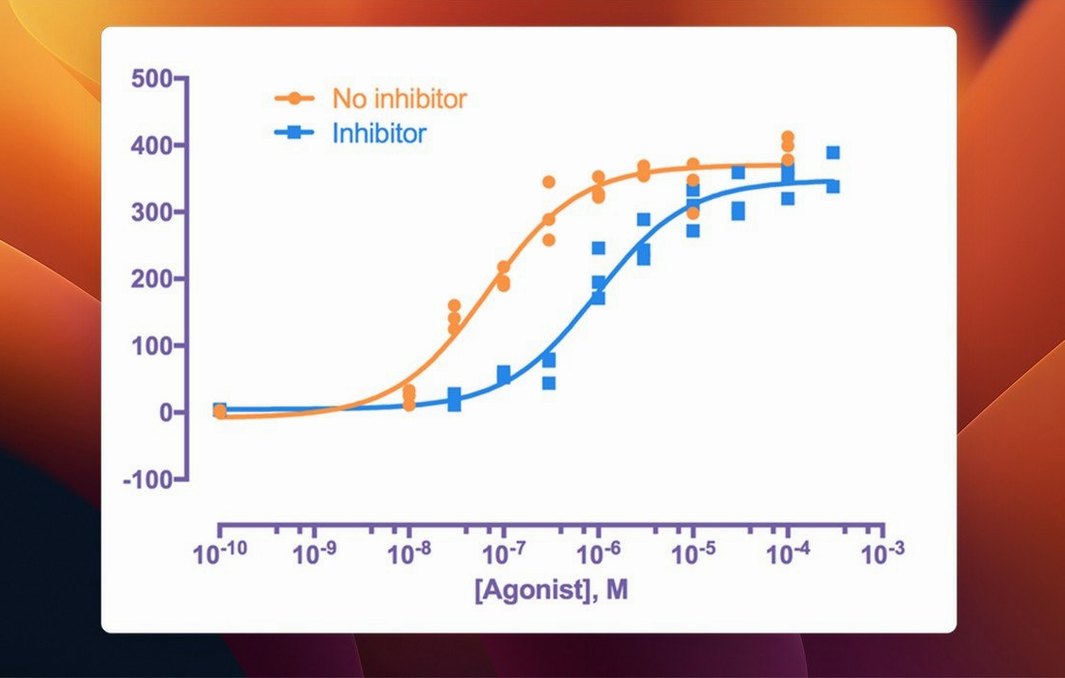
The real time-saver emerges when you repeat the experiment. Prism lets you duplicate the data table, paste fresh numbers into the same structure, and the analysis and graphs update without reconfiguration. On an Apple Silicon Mac, the curve fitting for dose-response curves feels instantaneous, keeping the exploratory flow uninterrupted.
Workflow: building a dose-response curve from raw plate data
Say you’ve run a 96-well plate with eight inhibitor concentrations in triplicate. You’ve exported the raw fluorescence reads as a CSV and now need an IC50 curve ready for a lab meeting slide. Here’s a path that keeps the steps tight.
Open Prism and pick the XY table type — choose the “Enter and plot a single Y value for each point” option, since each concentration will get the mean ± SD of your three wells. Paste your concentrations into X and the nine replicate values into three Y columns. Select the three Y columns, click Analyze, and pick Column statistics to compute mean and SD for each row. That lands in a results sheet you’ll reference when you label the graph.
Now go back to the data table, click Analyze again, and choose Nonlinear regression (curve fit). Under “Dose-response — Inhibition” pick log(inhibitor) vs. response -- Variable slope (four parameters). The dialog’s streamlined variable selector in version 11.1.0 means you assign each Y dataset to the model with a checkbox rather than hunting through tabs. Hit OK and the results sheet gives you the IC50, Hill slope, and confidence intervals in one table.
Head to the graph. Switch the style to Points & connecting line with error bars pulled from the SD you computed earlier. Add a second Y dataset for the curve-fit line — Prism automatically overlays it on the same axes. Export as PDF and drop it into the slide deck. The whole thing, from CSV import to finished graph, runs under ten minutes once the structure is set.
Picking the wrong table type buries your analysis
The wrong table type. It’s the most common stumbling block. If you’ve got multiple response variables measured on the same subjects — say, heart rate and blood pressure at four time points — don’t use an XY table. XY expects one independent variable. Use a Grouped table for two grouping variables or a Multiple Variables table when each row holds several measurements from one subject. Prism won’t stop you from making the wrong choice; it’ll just refuse to run the analysis you expected, or worse, run it with nonsense degrees of freedom.
Graphs not reflecting categorical order. Before 11.1.0, categorical variables in Multiple Variables tables sorted alphabetically by default, so “Week 10” landed before “Week 2.” Now you set the order in the Format Data Table dialog — drag the levels into the sequence you want, and every graph based on that table inherits it. If an old project’s graph suddenly reorders itself after upgrading, check that dialog first.
Curve fitting that won’t converge. When the four-parameter logistic model spits out “Ambiguous” or hits the iteration limit, switch to the three-parameter model log(inhibitor) vs. response — it forces the top and bottom plateaus to 100% and 0%. That often stabilizes noisy data. Also check your X values: concentrations entered as plain numbers (1, 10, 100) rather than log-transformed values give the solver a rougher starting landscape. If you must use raw concentrations, tick “Interpolate unknowns from standard curve” in the fit options rather than expecting the model to stretch across six orders of magnitude gracefully.
Analyses greyed out. The analysis menu disables options that don’t apply to the current table type. A Survival table won’t offer t tests. Before re-typing your data, right-click the table tab and choose Change table type — you can convert between compatible formats without losing numbers. Grouped tables can become Multiple Variables tables with one click; XY to Grouped is trickier and may need a copy-paste round-trip.
A pharmacologist’s afternoon
Lena runs compound screening at a mid-size biotech. On a Tuesday she has twenty-four test compounds from the chemistry team, each run at six concentrations against a kinase target. The raw data lands as twenty-four CSV files from the plate reader. She’s tried scripting this in Python, but the edge cases — missing wells, flagged outliers, compounds that need a different curve model — eat more time than the automation saves.
She opens Prism, creates one XY project, and pastes the first compound’s data. With the nonlinear regression dialog’s streamlined variable picker, she assigns the dataset, checks the log(inhibitor) vs. response — Variable slope model, and runs it. The results sheet pops up with the IC50. She copies the table, pastes the next compound’s numbers into the same structure, and hits Analyze again — the dialog remembers her model choice, so it’s a single click. By the twentieth compound, the rhythm is muscle memory: paste, Analyze, glance at the Hill slope for anything weird, flag the graph to the shared project folder.
One compound shows a biphasic curve — inhibition at low concentrations, activation at high ones. She switches its fit to a biphasic dose-response model. No rewriting loops, no debugging axis labels. The final graph sheet shows all twenty-four overlaid curves, color-coded by chemotype, with IC50 values in the legend. She exports the multi-page layout as a single PDF and emails the project file to her PI. The chemists get their SAR table before dinner.
Does it run natively on Apple Silicon?
Does this run natively on Apple Silicon? Yes. Prism 11 is a universal binary — it runs without Rosetta on M1, M2, M3, and M4 Macs. Nonlinear regression fits that used to show a beachball on Intel machines return results perceptibly faster. No separate download, no architecture preference to set.
Will it open files from really old Prism versions? Prism 11 reads .pzf and .pzfx files back to version 4. If your colleague still has a .pzm file from Prism 3, you’ll need to ask them to re-save it in a newer format first. Projects saved in Prism 11 can be opened in Prism 10, but new 11.1.0 features — like categorical level ordering — will revert to defaults on the older version.
Does it need an internet connection? No. The software runs fully offline. Browser-based activation exists for enterprise single sign-on environments, but if you’re installing independently, there’s no activation step at all. Some people look for a Prism 10 Mac crack or a GraphPad Prism torrent because they assume licensing is intrusive — the actual application doesn’t phone home and doesn’t require a constant connection once installed.
Can I export graphs for publication without re-touching them?
Comments 0
Sign in or create an account to leave a comment.
No comments yet. A codec, a slice, a machine — they appear after moderation.