
IDA Pro for macOS
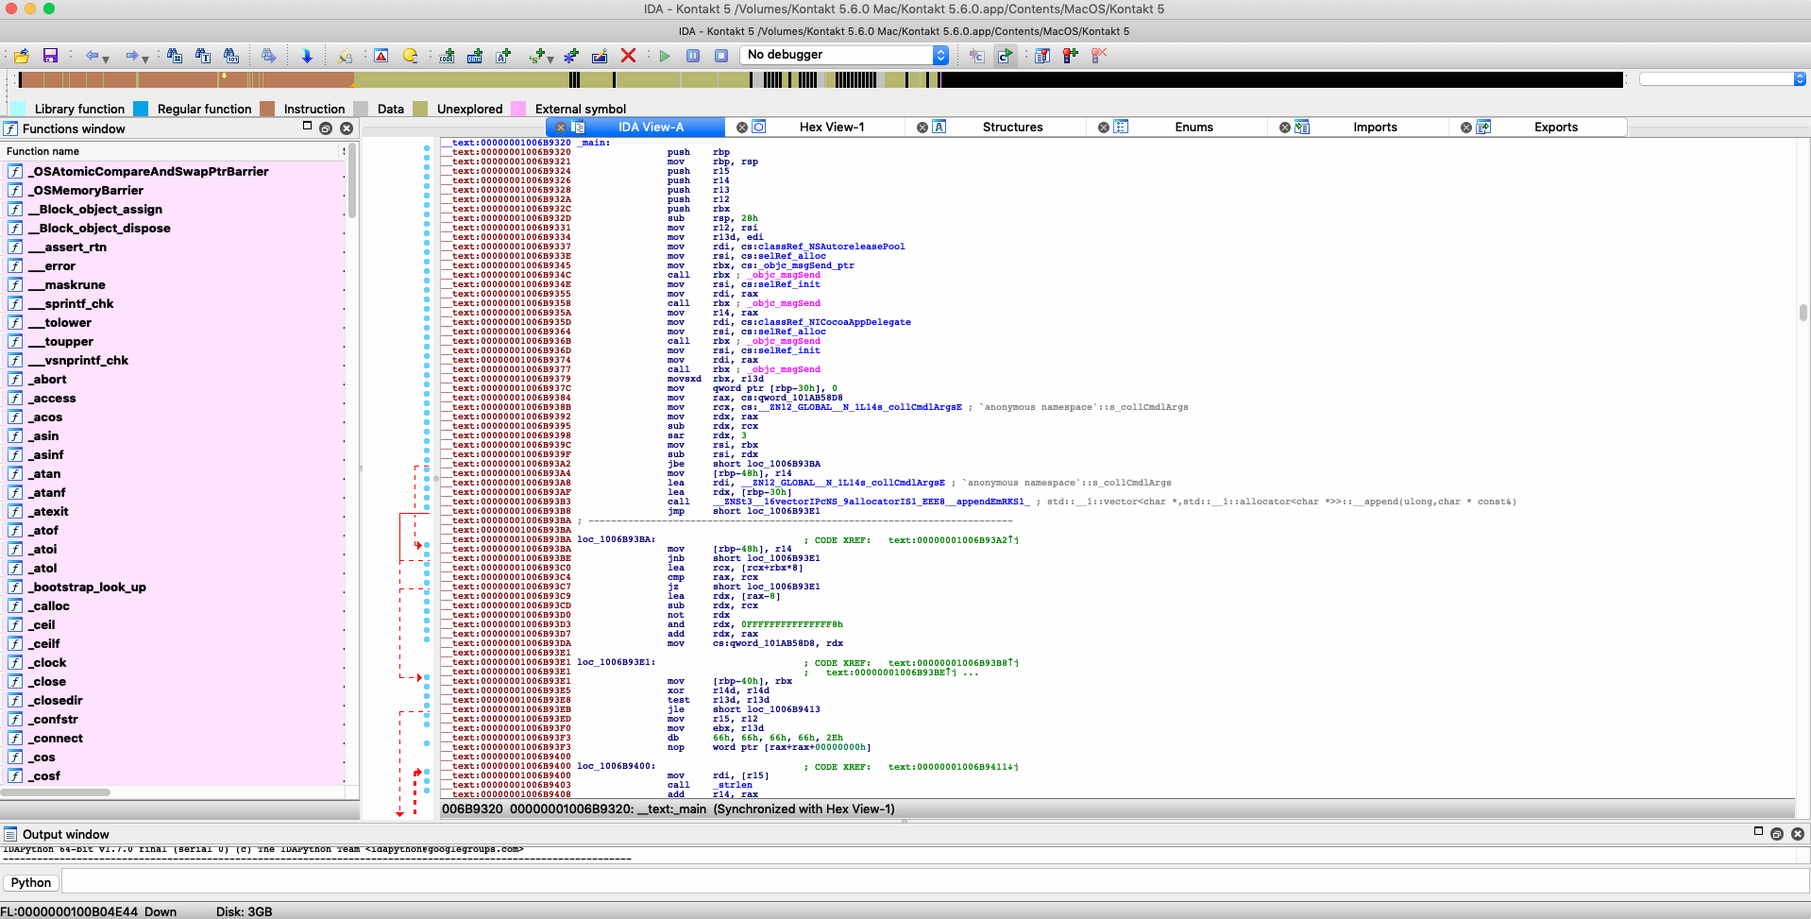
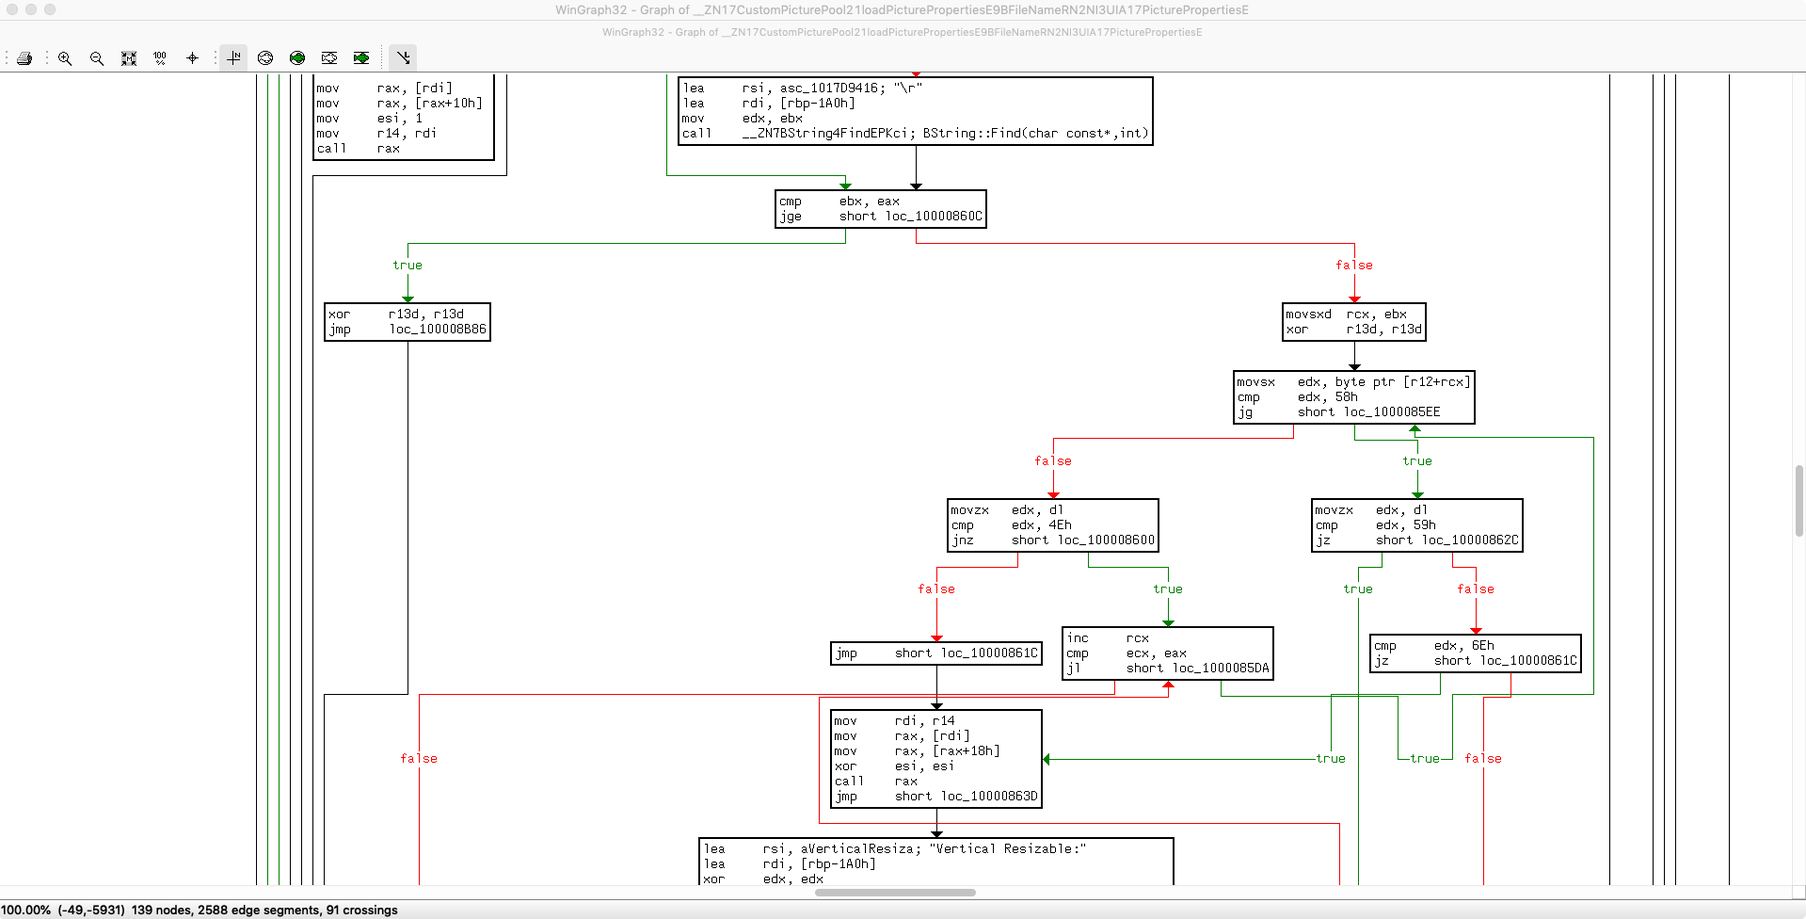
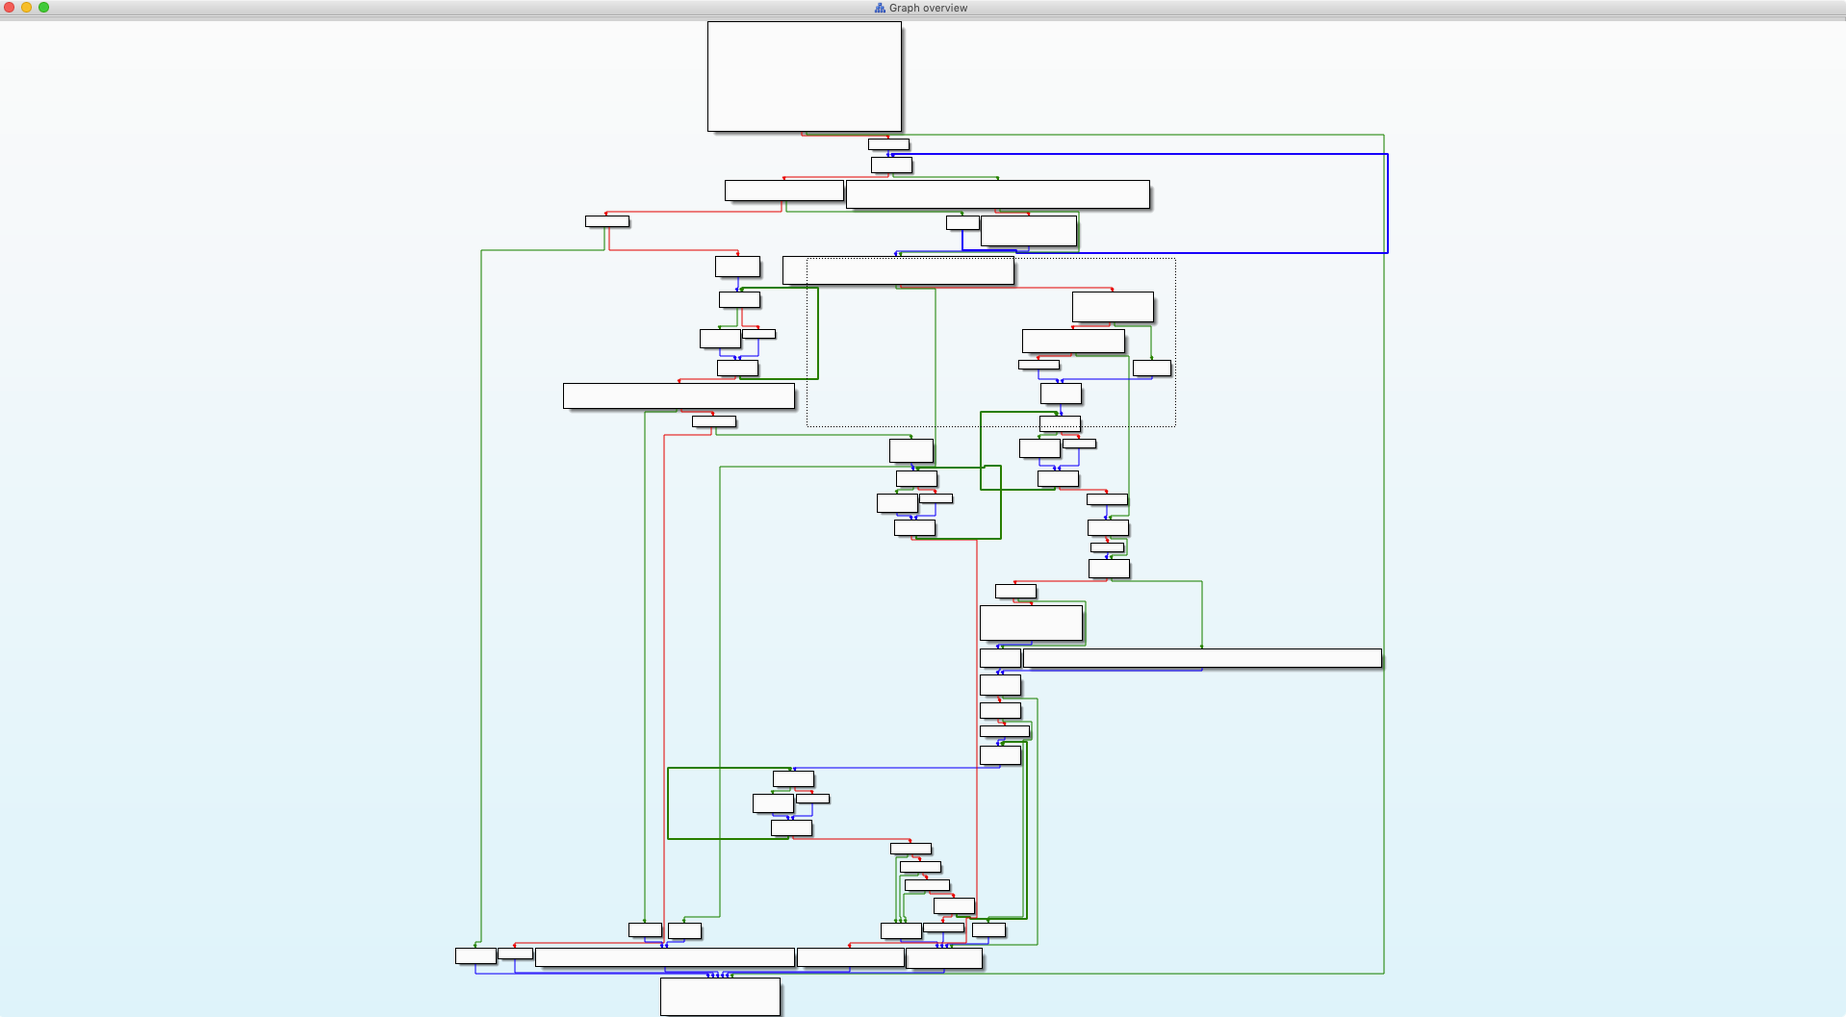
If you’ve spent time in a hex editor like ImHex and hit the wall where reading raw bytes isn’t enough, IDA Pro is the logical next step. It’s an interactive disassembler and debugger built for picking apart binary code, converting machine code back into assembly-language source so you can follow the logic a compiler laid down.
Mach-O, ELF, PE, and now Qualcomm MBN boot-images
IDA supports a long list of executable file formats across different processors and operating systems—Mach-O, ELF, and PE are just the start. The 9.4 release adds a Qualcomm MBN boot-image loader and a new Hexagon QDSP6 processor module, extending reach into firmware and embedded DSP binaries.
FLIRT labels known library functions so you skip straight to custom code
FLIRT (Fast Library Identification and Recognition Technology) automatically spots standard library functions in the disassembly. Instead of reverse-engineering printf from scratch for the hundredth time, you get a labeled call straight away—huge for focusing on the custom logic that actually matters.
What debugging is built in?
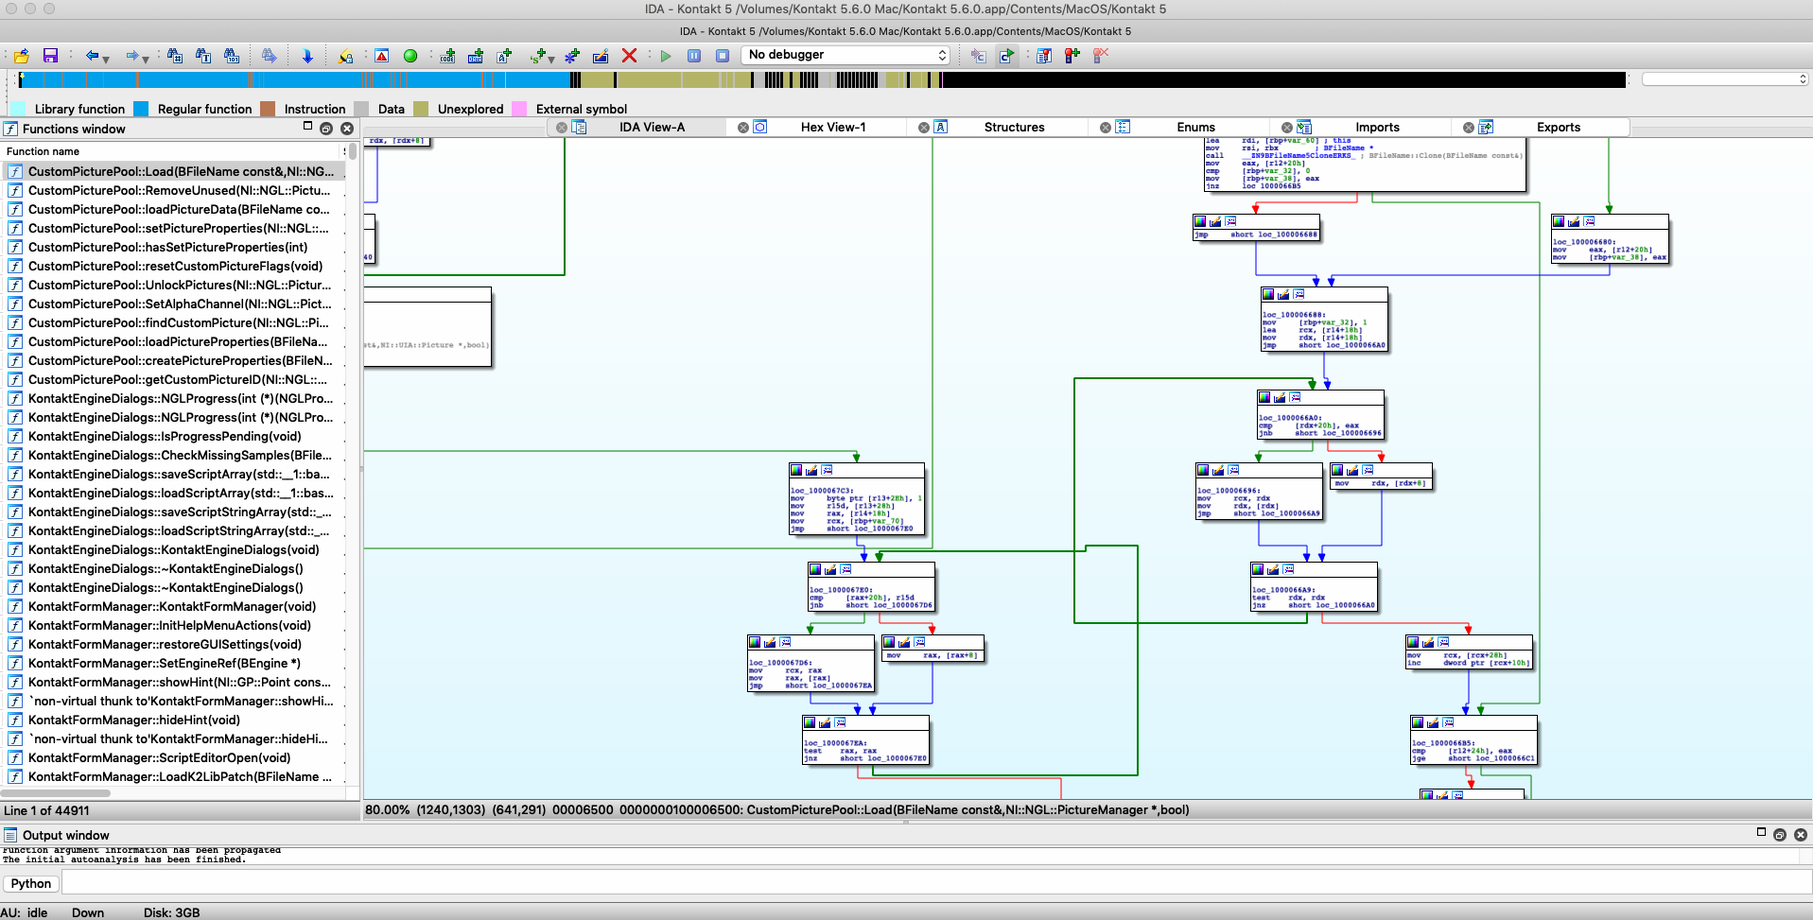
There’s a built-in data debugger, and the navigation tools make stepping through control flow graphs feel closer to reading source than staring at a hex dump. For teams, Git server support is available in the Teams add-on, so collaborative analysis on a shared repository becomes workable.
From binary blob to a picture of what it does
Suppose you’ve grabbed a suspicious .macho file and you want to understand its network behavior without running it. Fire up IDA, load the binary, and let the auto-analysis complete—FLIRT will light up standard calls like connect, send, and recv. Jump straight to the Imports tab and double-click connect; cross-references show every place the binary attempts a socket connection. Drop into the graph view, rename the host variable to something readable, and note the port pushed onto the stack. In ten minutes you’ve mapped the C2 infrastructure without touching a debugger.
Next, open the Strings window and filter on http. Often you’ll spot user-agent strings or URI paths sitting right next to the networking calls you just labeled. Select a string, hit X for cross-references, and rename the calling function build_http_request. Add a repeatable comment describing the protocol quirk you noticed—the comment propagates everywhere that function is called, so later you don’t have to reconstruct the logic a second time.
If the binary strips symbols, don’t grind through it manually yet. Run the bundled idc script console and dump function boundaries to an output window; that quick map tells you whether you’re looking at a small downloader or a large modular implant before you invest hours.
First days: what saves real time
On macOS the app ships inside a standard disk image—drag it to /Applications like any other tool. Before opening your first real sample, spend twenty minutes on a tiny test binary you compiled yourself. The habit to lock in early: set a stack-pointer delta for every function you identify. It’s a small extra click that makes pseudocode views far more readable when you later switch between graph and linear modes.
Map the G (go to address) and N (rename) shortcuts to muscle memory on day one. Also worth knowing: IDA’s database packs into a single .i64 file. Back it up before running any aggressive plug-in or script—reverting a corrupted analysis database is trivial if you kept the snapshot, and painful if you didn’t. The 9.4 build runs natively on Apple Silicon, so you can throw large Dyld Shared Cache dumps at it and the UI stays responsive while the new DSC infrastructure parses the cache structure.
Exporting payload bytes from Wireshark into IDA
IDA fits into a small toolchain rather than trying to swallow every task. A common pairing: capture network traffic with Wireshark or mitmproxy, spot a buffer that looks like a custom protocol, export the payload bytes, and load them as a raw binary into IDA. Pick the suspected processor architecture, define a function at the entry point, and suddenly the blob has structure.
For malware triage on macOS, the dyld_shared_cache utilities in /usr/bin extract system libraries that IDA can then analyze with the new DSC infrastructure—useful when you’re checking whether a sample hooks _dyld_register_func_for_add_image. On the debugger side, the built-in server component lets you attach to a process running on a separate VM; set up a lightweight Ubuntu VM in UTM, copy over the debugger stub, and you’ve got a disposable analysis sandbox that leaves your main machine clean. The IDC scripting engine also talks to Python through the IDAPython bridge, so I’ll often pipe annotated function lists out to a CSV and feed them into a Jupyter notebook for pattern matching across multiple samples.
- A new Hexagon QDSP6 processor module for Qualcomm DSP code.
- Qualcomm MBN boot-image loader for analyzing firmware images directly.
- Dyld Shared Cache infrastructure rewritten for modern macOS binaries.
- Swift analysis improvements for cleaner disassembly of Apple’s language runtime.
- Pathfinder added for visual execution-path tracing.
- macOS 10.15 or later
- Runs natively on Intel and Apple Silicon
$ man ida-pro | grep -A2 "?"
Is IDA Pro a decompiler or a disassembler?
It’s both. The disassembler translates machine code into assembly language, while the decompiler (via the Hex-Rays plug-in) attempts to reconstruct higher-level, C-like pseudocode from that output.
What is IDA Pro used for in security?
It’s a core tool for software security auditing—malware analysts and vulnerability researchers use it to trace execution paths, understand obfuscated routines, and inspect how a binary interacts with the operating system.
What is Pathfinder in IDA 9.4?
Pathfinder is a feature newly added in version 9.4. It helps an analyst visually trace execution paths through the disassembly graph, reducing the cognitive load of following complex branching logic.
Comments 0
Sign in or create an account to leave a comment.
No comments yet. A codec, a slice, a machine — they appear after moderation.