iStat Menus for macOS
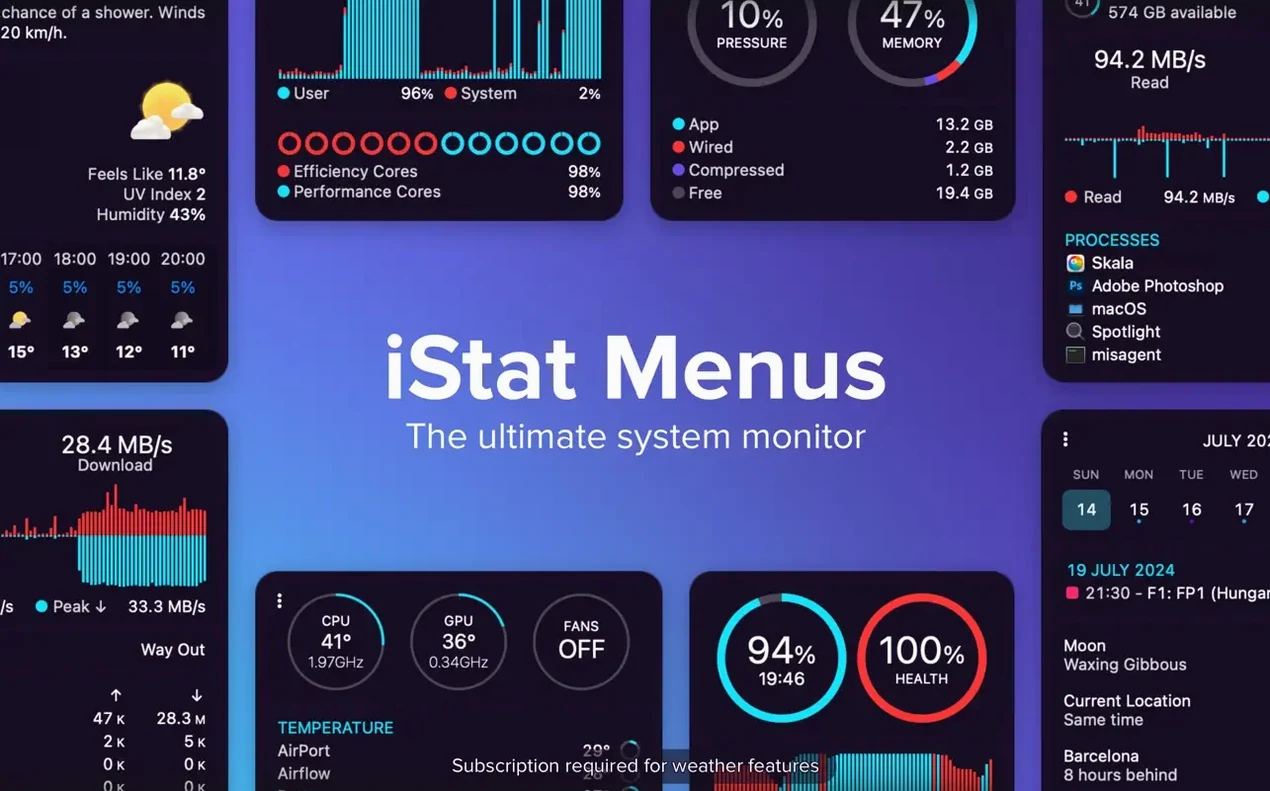
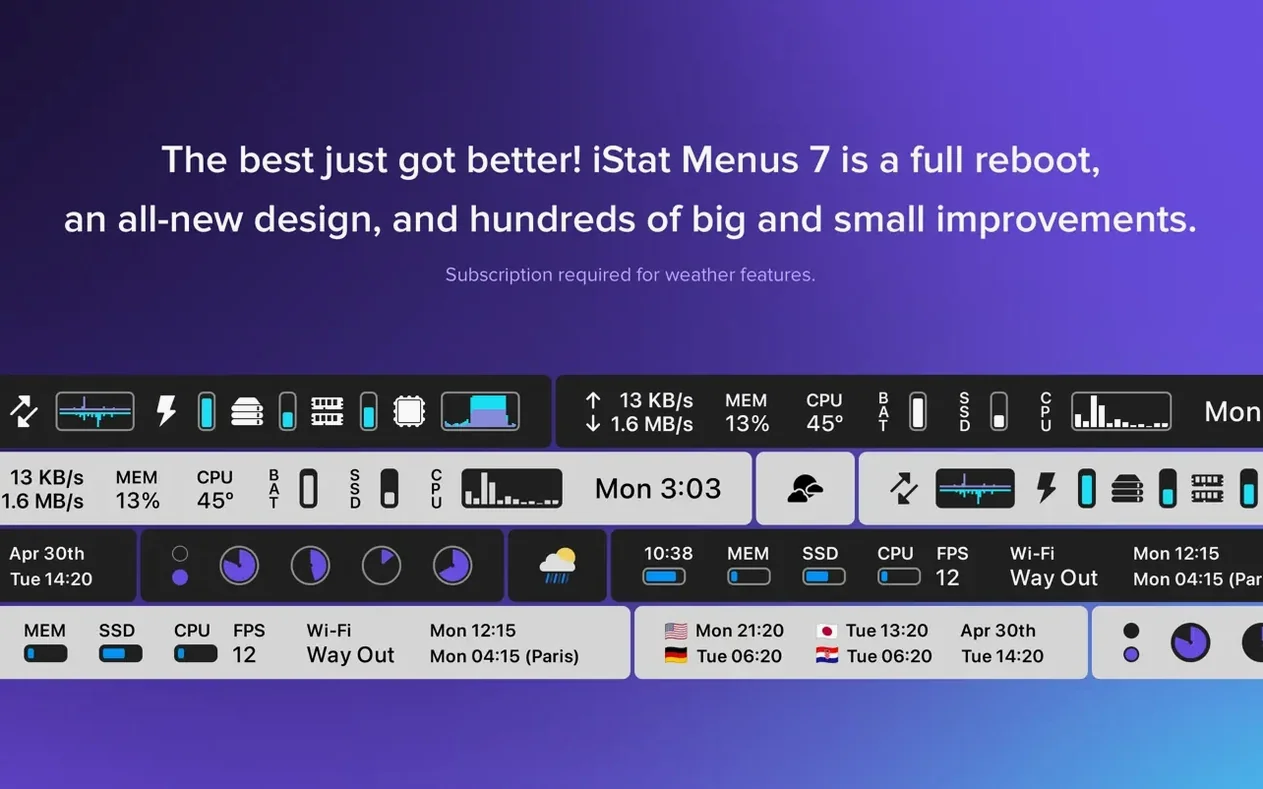
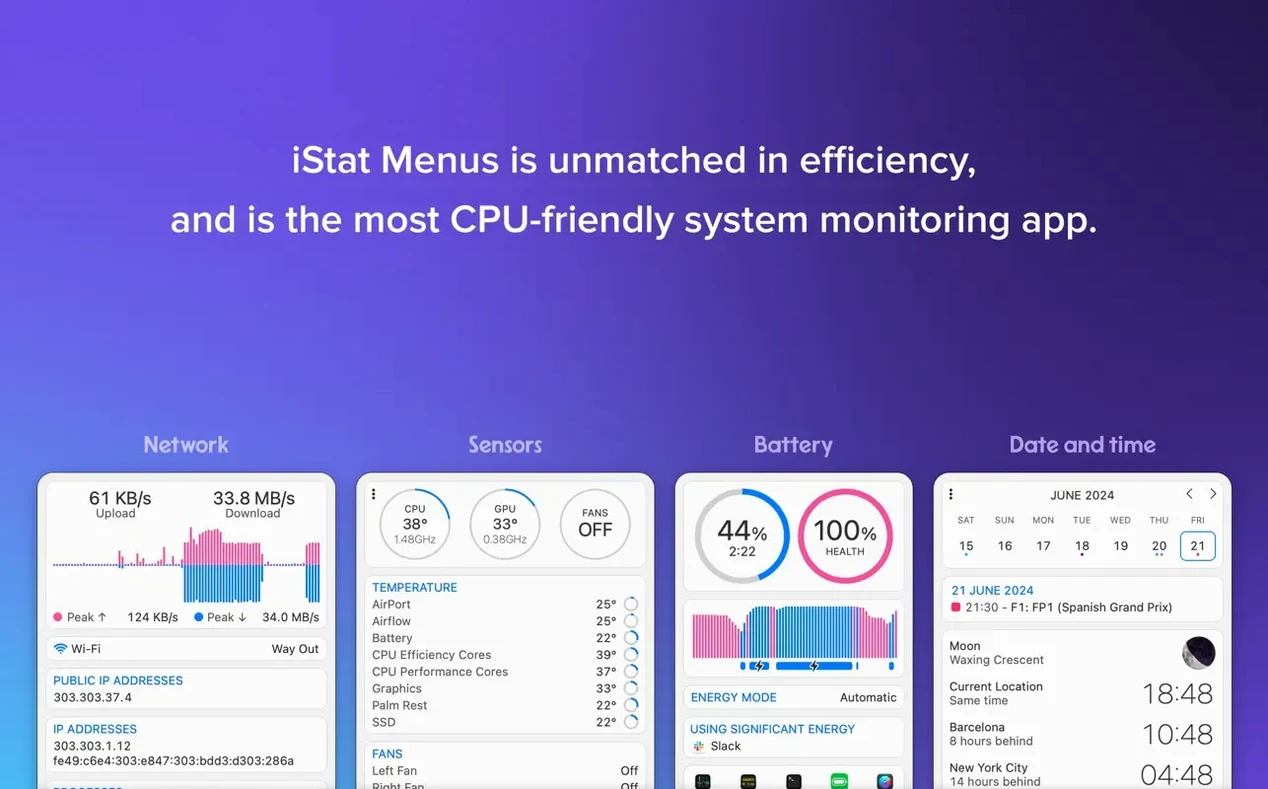
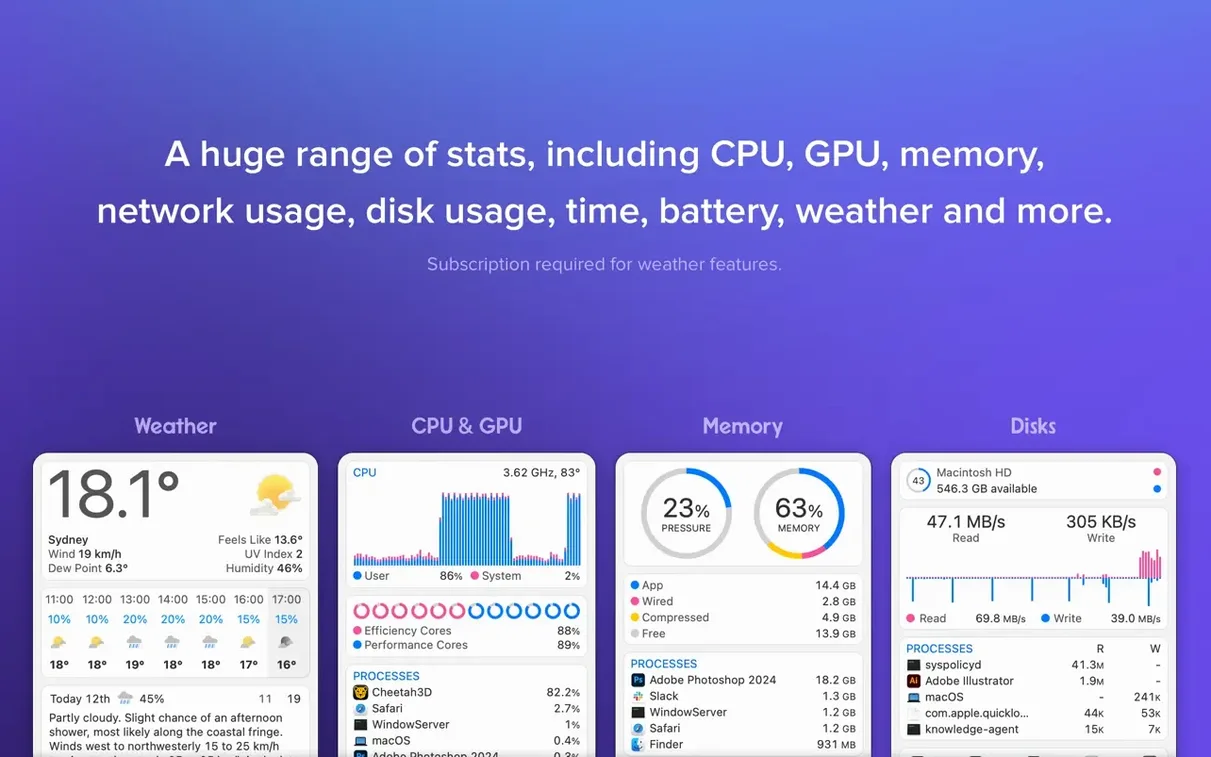
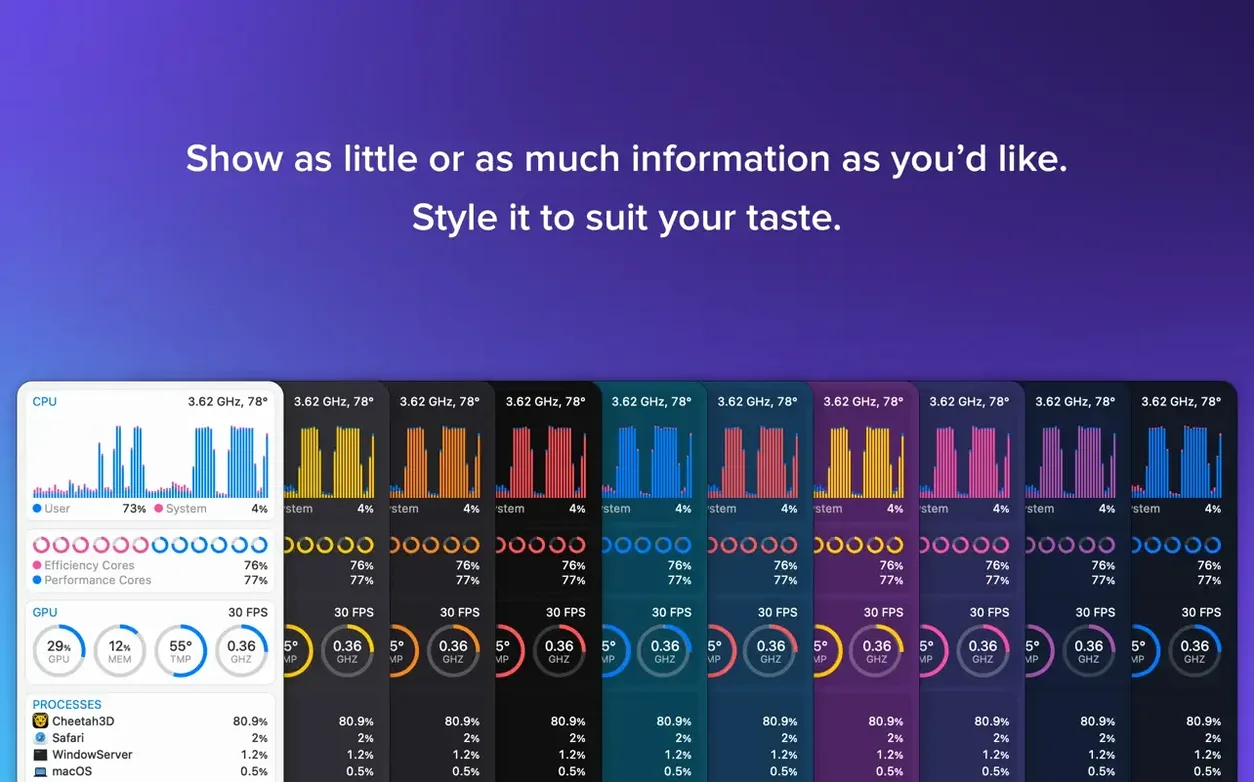
iStat Menus is a system monitor that lives entirely in your Mac's menu bar, turning a glance upward into a full hardware dashboard. Version 7.50 refines that dashboard without rebuilding the instrument panel.
The workflow is straightforward. First, you decide what matters. The app can display CPU load as a tiny graph, GPU activity, memory pressure, network throughput, disk I/O, battery health, and even weather pulled from a local station. Each module gets its own menu bar slot, and you arrange them by command-dragging the items into position. Next, you tune the detail level. Clicking a CPU graph opens a dropdown with per-core history and a list of the processes eating cycles. The memory dropdown sorts apps by active consumption so you can spot a runaway browser tab in seconds. Finally, you set alerts and rules. Under the sensors panel, you can define fan speed curves that kick in when the machine is on battery, or have the menu bar text turn red if a temperature sensor crosses a threshold.
What stayed the same is the architecture: it is a native universal binary, so Apple Silicon and Intel 64-bit Macs both run it without translation, and it still leans on the iStat Menus Helper background tool to read low-level sensors for voltage, current, and fan speeds.
We see istat menus for mac searched a fair bit by people who run compute-heavy audio sessions, and I get why. Picture a producer deep in a mix, fifty tracks running into a dozen buses, and the MacBook Pro fans suddenly howl. The first instinct is to open Activity Monitor, but that is slow and chunky. With iStat Menus she already has a CPU graph sitting in the menu bar next to a memory pressure ring. She glances up, sees a single core pegged at 100% because a reverb plugin went haywire, and clicks the dropdown to kill the offending process before the transport stutters. Meanwhile the fan speed rule she set last week — ramp to 4000 RPM when the CPU proximity sensor hits 75°C — has already spun the fans up early, giving her headroom. That is the kind of scenario where a lightweight monitor earns its keep: it surfaces trouble before it becomes a dropout.
What MenuMeters leaves on the table
Put next to MenuMeters, which is open-source and has a loyal following, iStat Menus shows its age in a good way. MenuMeters covers CPU, memory, disk, and network in the menu bar with minimal fuss, but it stops there. You do not get GPU tracking, detailed sensor readouts, weather, or fan control. MenuMeters is the four-gauge dashboard; iStat Menus is the full glass cockpit. For a user who just needs a network throughput counter, MenuMeters does the job. For someone who wants to see per-app network connections, S.M.A.R.T. disk health, and voltage rails alongside that counter, iStat Menus is the obvious upgrade path.
Stats, another menu bar monitor, is newer and takes a more minimal approach. Its sensor list pulls from the same SMC data that the iStat Menus Helper reads, but it does not expose fan speed rules or a multi-day weather forecast. Stats is also actively developed and fits a clean single-menu design, whereas iStat Menus scatters individual items across the bar. The difference is density. With Stats you open one panel to see everything; with iStat Menus you read the bar itself as a live dashboard and then drill down. Neither is wrong — it is a question of whether you want a single instrument cluster or a row of dedicated dials.
Workflow: building a network-plus-disk watcher for a file server
Imagine a Mac Mini acting as a home file server. You care about two things: is the gigabit link saturated, and are the spinning drives healthy. Here is a start-to-finish setup for exactly that.
1. Turn off everything you do not need. Open iStat Menus and in the main panel uncheck CPU, GPU, memory, battery, and weather. No point in clutter.
2. Activate the Network item. Under the Network tab, set the menu bar display to show download throughput as a numeric value with a small line graph. In the dropdown preferences, tick the option to show per-app connections; this is useful when you want to see which service is pulling data.
3. Add the Disks item. Set the menu bar to show read and write activity as a split graph. In the dropdown, enable S.M.A.R.T. monitoring for every internal drive. The app will now list each disk’s overall health status, temperature, and any pre-fail indicators the drive firmware reports.
4. Position and lock the items. Command-drag the network graph to the far left of the menu bar and the disk activity graph next to it. The rest of the bar stays free for other menu extras.
5. Set an alert. In the Disks settings, add a rule: if any drive reports a S.M.A.R.T. status of “Failing,” turn the menu bar text red and fire a notification. That way a degrading drive does not go unnoticed until the next manual check.
The whole setup takes under three minutes. From then on, a single glance at the menu bar shows whether the network is saturated and whether the drives are busy — and an alert covers the rare but critical case of hardware failure.
Battery and thermals during a Python batch run
I sat down this morning with a 14-inch MacBook Pro running a batch of Python data-processing scripts. The machine was on battery, a coffee shop table my office. Here is how iStat Menus threaded through the next hour.
I opened the lid and the battery item showed 87%, with a discharge estimate of 4 hours 12 minutes. Good enough. I started the script and watched the CPU graph spike across all performance cores — the bar chart filled immediately, as expected for a NumPy operation grinding through a large array. The memory pressure ring stayed green, which told me the dataset was not stressing the 32 GB of RAM; no surprise, but reassuring.
About twenty minutes in, the fan graph in the sensors dropdown climbed from 1800 RPM to 3200 RPM. The CPU proximity sensor read 82°C. I had not set a custom fan curve for battery operation, so the system default was handling it. The temperature settled at 85°C and held there, fans audible but not obnoxious.
A notification pinged — my custom disk alert warned that free space on the internal SSD had dropped below 20 GB. I glanced at the disk activity graph, which confirmed heavy write throughput from the script’s temporary output. I paused the job, cleaned up old .dmg files and build artifacts, and resumed. The alert cleared within seconds.
Toward the end of the batch, the Weather item updated to show a rain cell moving in over the next hour. I packed up. That is the rhythm iStat Menus establishes: you work, the machine pushes itself, and the menu bar feeds you just enough data to catch problems without pulling you out of the task.
- New Astronomy menu bar item for sky-watchers.
- Forecasts for seeing, transparency, cloud cover, and other observing conditions added.
- macOS 11 or later
- Apple Silicon or Intel 64-bit Mac
$ man istat-menus | grep -A2 "?"
What does the new Astronomy item show?
Version 7.50 adds an Astronomy menu bar item with forecasts for seeing, transparency, cloud cover, and other observing conditions.
Why is the iStat Menus Helper needed?
The background helper tool reads hardware sensors directly, so certain stats like fan speeds, voltage, and current require it to be installed and running.
Which power information can I monitor?
You can monitor battery health, charge cycles, power source, current draw, and voltage, and you can set custom fan rules that activate specifically when running on battery.
Comments 0
Sign in or create an account to leave a comment.
No comments yet. A codec, a slice, a machine — they appear after moderation.